Kartoza - Unlocking the World in Your Classroom: Namibia & eSwatini Topo Sheets, New Thematic Projects, and Dynamic Indexes
The SAGTA Map Downloader just levelled up! Discover new Namibia and eSwatini topo sheets, dynamic map indexes, and rich thematic mapping projects built for the modern Geography classroom.
If you teach Geography, or Social Sciences in Grades 8 and 9, in Southern Africa, you know the struggle of finding high-quality, relevant, and curriculum-aligned maps for your classroom. The days of fighting with a temperamental photocopier over a faded, ten-year-old map sheet are officially behind us.
Thanks to the ongoing partnership between SAGTA and Kartoza, the SAGTA Map Downloader has levelled up. We are constantly looking for ways to make this a more robust tool for educators. Geography doesn't stop at the border, and neither should our classroom resources.
Whether you are demonstrating geomorphology, tackling map work skills, or exploring global climatic regions, the latest updates make teaching and learning easier, faster, and much more interactive. Here is a breakdown of the brand new features, the expanded map suites, and the technical heavy lifting that makes it all possible.
What’s New: Cross-Border Topo Sheets, Thematic Mapping & Dynamic Indexes
The Map Downloader has expanded far beyond basic topographic sheets. Once you log in with your SAGTA membership credentials, you'll find a suite of new data projects and features designed specifically for the modern classroom:
1. Namibia and eSwatini Topographical Sheets Added
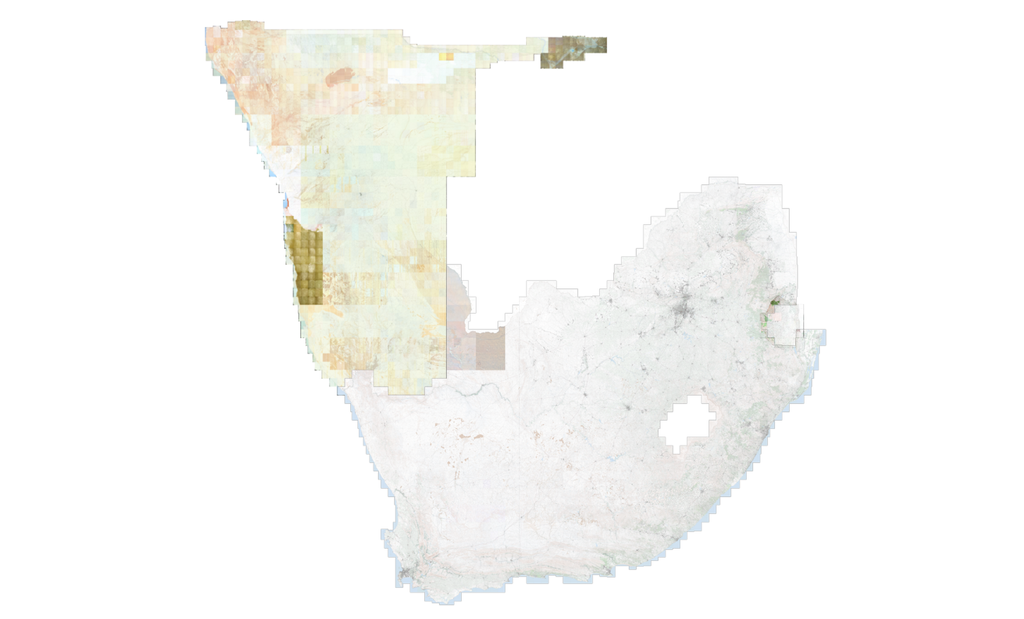
We are thrilled to officially announce the integration of both Namibia and eSwatini topographic map sheets into our main Topo Map project. Teachers and students can now seamlessly generate high-quality, 1:50 000 topographic layouts that span across South Africa, Namibia, and eSwatini. This massive cross-border expansion provides a fantastic opportunity for comparative regional studies across Southern Africa.
2. Brand New Thematic Mapping Projects
We are incredibly excited to introduce two entirely new project suites dedicated to thematic mapping. These datasets were specifically curated to align with the CAPS curriculum, allowing teachers to visually demonstrate complex regional and global concepts:
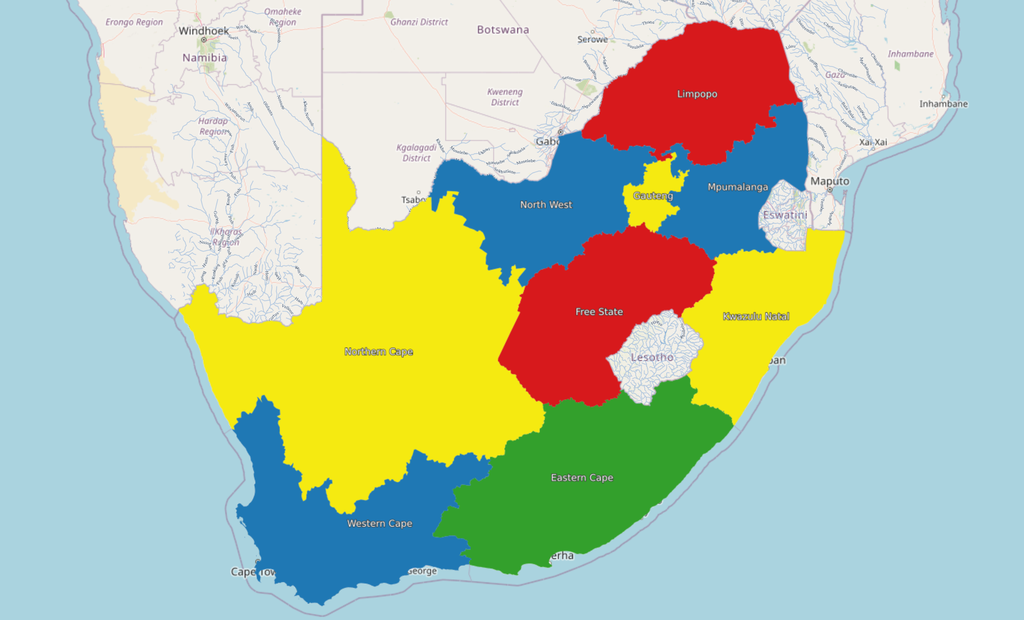
- South African Thematic Project: We have built out a comprehensive national GIS dashboard. Teachers can now seamlessly layer critical syllabus data, including:
- Demographics & Economy: Population density (featuring 2025 projections), active mining distribution, and agricultural/forestry regions.
- Physical Geography: Detailed vegetation/biomes, geology, and hypsometric units.
- Climatology: Extensive climate data, including mean annual precipitation, average monthly rainfall, and temperature gradients.
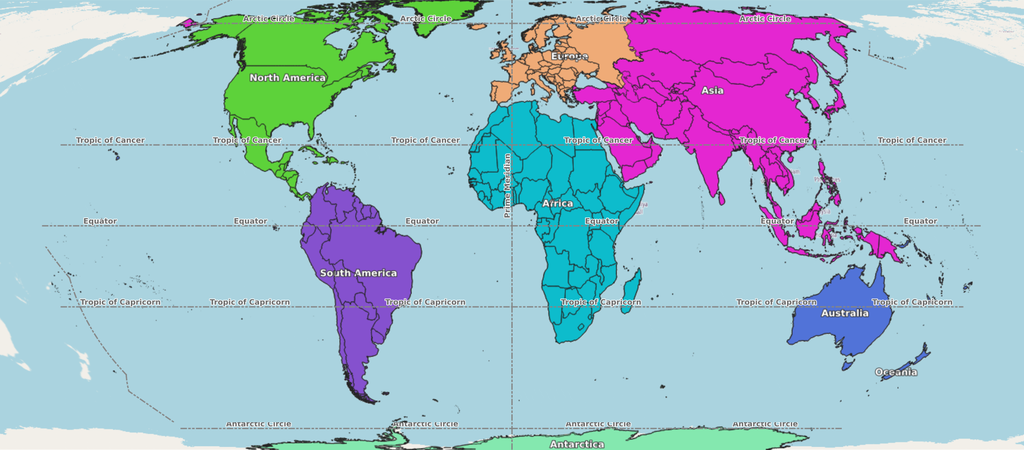
- World Thematic Project: Taking geography to a global scale! This new project brings macro-level analysis into the classroom with high-quality datasets like GPW 2020 global population density, up-to-date global climatic regions (1991–2020), major ocean currents, and tectonic plate boundaries.
3. Dynamic Map Sheet Indexes
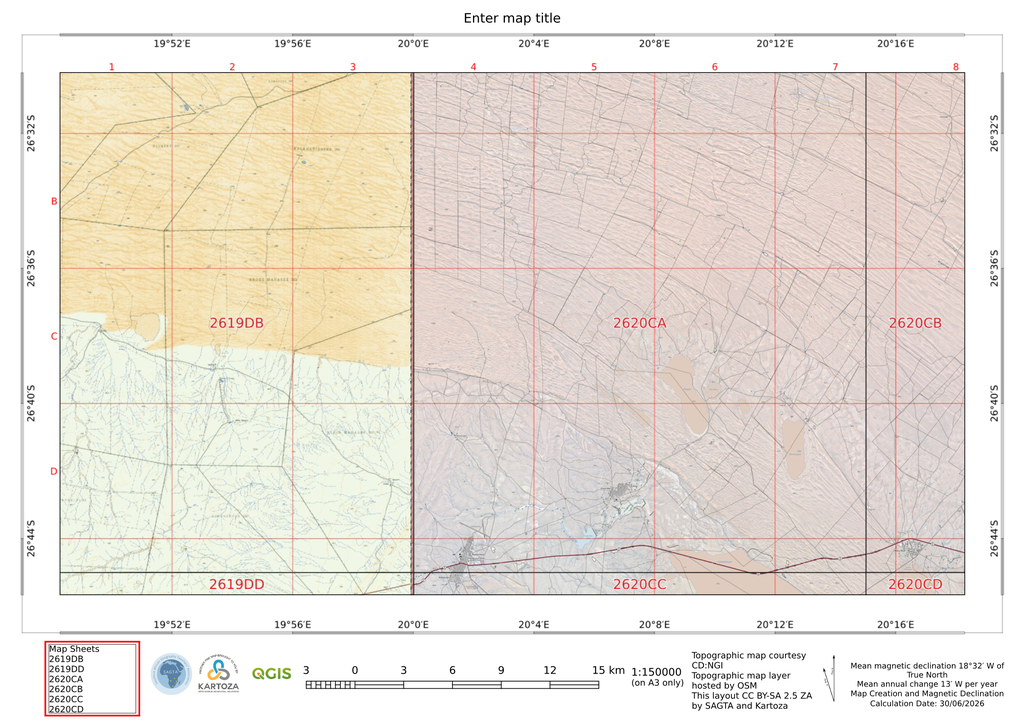
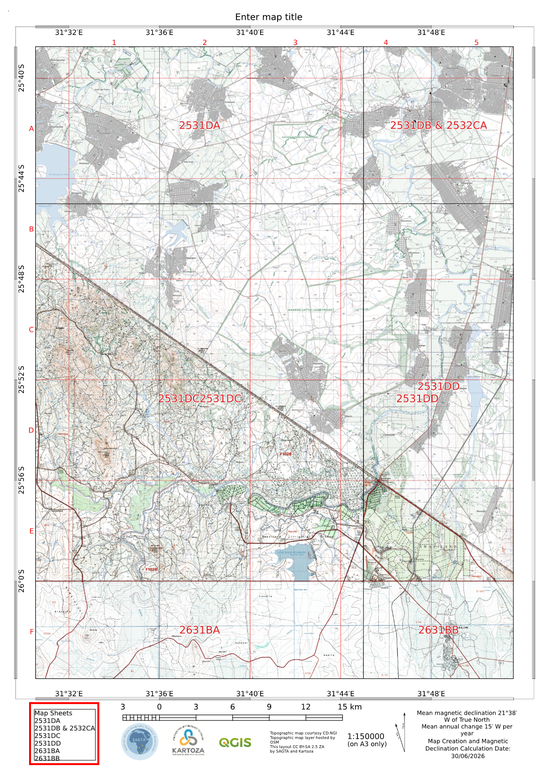
Knowing your surrounding sheets is a fundamental mapwork skill. Because our Topo maps now span three countries, we have introduced functionality to automatically display the correct map sheet indexes directly in the generated print layouts.
| Country | Index Feature | Benefit for the Classroom |
| South Africa | 1:50 000 Grid Indexing | Easily identify adjoining standard NGI map sheets. |
| Namibia | 1:50 000 Grid Indexing | Seamless cross-border navigation and reference. |
| eSwatini | 1:50 000 Grid Indexing | Unified experience when exploring newly added spatial data. |
The Rest of the Map Suite & Web Tools
Alongside our new cross-border and thematic data, you still have access to our core high-resolution map projects and browser tools:
- Topographic Maps: The classic 1:50 000 data. Best for core mapwork skills and physical geography.
- Orthophoto Maps: High-resolution aerial imagery overlaid with a mixture of 5-metre and 20-metre contours alongside spot heights (South Africa only). Perfect for micro-scale geomorphology and urban settlement analysis.
- Hybrid Maps: A perfect blend of aerial imagery overlaid with topographic data, major rivers, and dams. Great for transitioning students between abstract map symbols and real-world imagery.
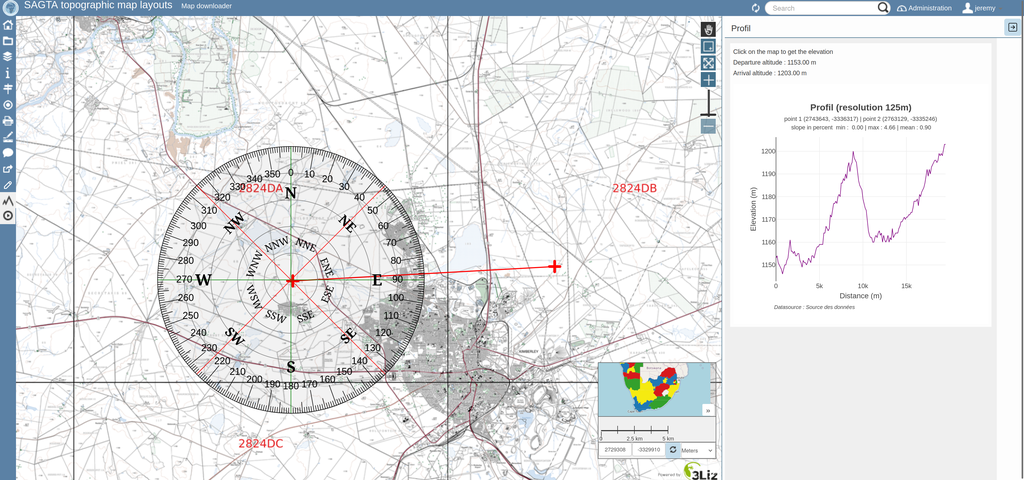
- Interactive Web Tools: You don't just download maps anymore; you interact with them. The interface includes a built-in Elevation Profile generator, a Protractor, Annotation tools, and Measuring capabilities directly in your browser. The Protractor and Profile tool are shown below.
- Flexible Export Options: Generate maps in PDF, PNG, JPEG, and SVG formats across A4 and A3 sizes (both landscape and portrait).
Under the Hood: The Technical Architecture
Building a platform that can seamlessly render complex, multi-layered maps—like our new global climate regions or 2025 population densities—on demand requires serious technical architecture. Powered by QGIS Server and Lizmap, the Map Downloader utilises powerful open-source geospatial tech to deliver its results.
- QGIS & OpenStreetMap Integration: The backend infrastructure allows for dynamic, high-fidelity rendering of spatial data, heavily supported by base layers from OpenStreetMap (OSM) to ensure the maps are globally accurate.
- NGI Spatial Content: The core spatial data is sourced directly from the National Geo-spatial Information (NGI) servers. The platform fetches and renders this high-resolution data on the fly.
- Streamlined UI & Automated Elements: The front-end has been optimised to reduce rendering times. Critical map elements like the current magnetic declination and accurate legends are dynamically generated and placed on your chosen layout automatically.
Deep Dive: Dynamic Print Layouts via QGIS Expressions
The biggest technical hurdle for this update was getting the print layouts to "know" which map sheet index to display based on the user's current viewport. Instead of relying on complex front-end logic, we leveraged advanced QGIS layout expressions.
Because our users can generate map extracts that overlap national borders, the expression needs to check three distinct national index layers simultaneously, handle data arrays, and format the output beautifully for a print layout.
Here is the actual QGIS expression we use to drive this feature:
with_variable('extent',transform(map_get(item_variables('LayoutName'), 'map_extent'),map_get(item_variables('LayoutName'), 'map_crs'),'EPSG:3857'),with_variable('sheets_sa',aggregate('sa_index1in50k','array_agg',"sh_no",filter := intersects($geometry, @extent)),with_variable('sheets_nam',aggregate('nam_index1in50k','array_agg',"sh_no",filter := intersects($geometry, @extent)),with_variable('sheets_sz',aggregate('eswatini','array_agg',"sh_no",filter := intersects($geometry, @extent)),with_variable('sheets',array_sort(array_distinct(array_cat(array_cat(coalesce(@sheets_sa, array()),coalesce(@sheets_nam, array())),coalesce(@sheets_sz, array())))),CASEWHEN array_length(@sheets) > 6 THENwith_variable('col1', array_slice(@sheets, 0, 6),with_variable('col2', array_slice(@sheets, 6, array_length(@sheets)),with_variable('max_rows',if(array_length(@col1) > array_length(@col2),array_length(@col1),array_length(@col2)),'Map Sheets' || '\n' ||array_to_string(array_foreach(generate_series(0, @max_rows - 1),format('%1 %2',coalesce(@col1[@element], ''),coalesce(@col2[@element], ''))),'\n'))))ELSE'Map Sheets' || '\n' || array_to_string(@sheets, '\n')END)))))
How it works:
- Coordinate Transformation: First, it captures the user's map extent (
map_extent) from the layout and transforms it to Web Mercator (EPSG:3857) so it accurately aligns with our master index layers. (Note: TheLayerNamevariable in the code above is specific to that particular map layout. Our system dynamically updates this variable depending on whether the user selects an A4 portrait, A3 landscape, or any of our other layout options for their export). - Targeting Multiple Indices: The expression then triggers three distinct aggregate functions, querying the individual index layers for South Africa, Namibia, and eSwatini. It searches for the
"sh_no"(sheet number) wherever the grid intersects the layout's bounding box. - Data Handling & Cleaning: It merges these results into a single array (
array_cat), removes any potential null values or duplicate sheet numbers (coalesceandarray_distinct), and sorts them alphabetically. - Smart Formatting: Finally, it checks how many map sheets were found. If there are more than six intersecting sheets, it dynamically splits the list into two neat columns to save space on the final PDF layout. Otherwise, it generates a simple, single-column list.
Ready to Start Mapping?
The Map Downloader is a game-changer for spatial education in Southern Africa, bringing real-world GIS capabilities into a user-friendly, educator-focused platform.
If you haven't explored the new updates yet, head over to maps.sagta.org.za, log in with your SAGTA credentials, and start exploring.
Note: Don't forget to enable pop-ups in your browser so your maps can export and download seamlessly!



No comments yet. Login to start a new discussion Start a new discussion